Test Your Tracking
This article will walk you through how to test that you've added the script correctly. You can use the following three methods to do this: using our tracking chrome extension, debugging through the web browser, or using the Dreamdata app's built-in debugger. Note that only the debugger, Method 3, can be used to test Server-Side Tracking because of where it sends events.
The first two methods will work only for events sent via your site. So you won't be able to test events sent with other methods, such as from Zapier, here.
Method 1: Dreamdata Tracking Validator
This is a tool that makes it easier to find which events are being sent to dreamdata. You can download the chrome extension via this link. The extension is not part of the Dreamdata product but is an extra free tool that we offer to help you test your tracking set up.
What to Look For
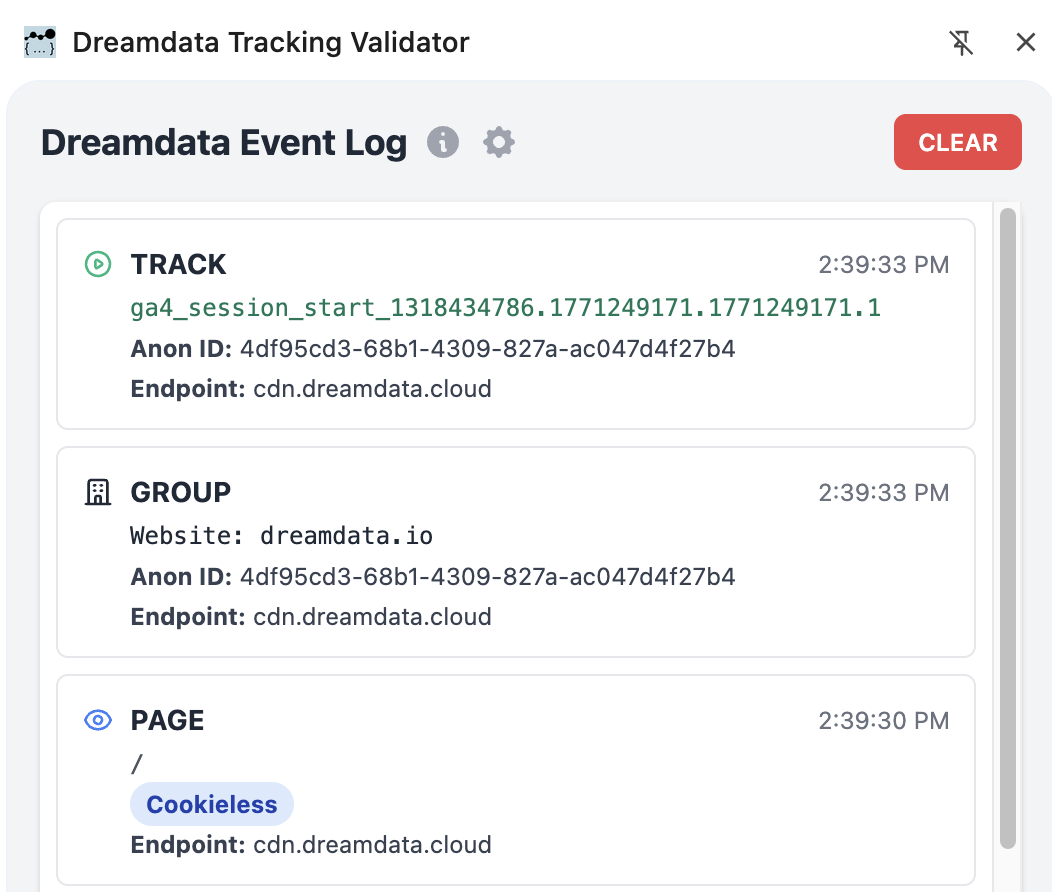
These are the event types as displayed in the Tracking Validator.
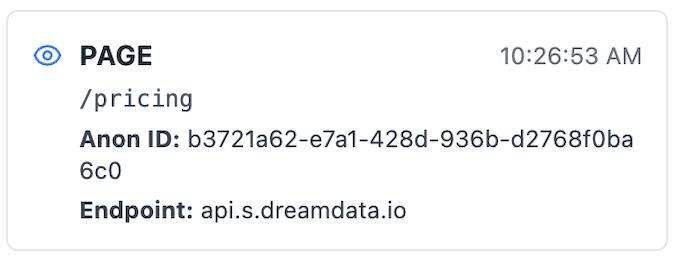
The “Normal” script firing will show a page view:
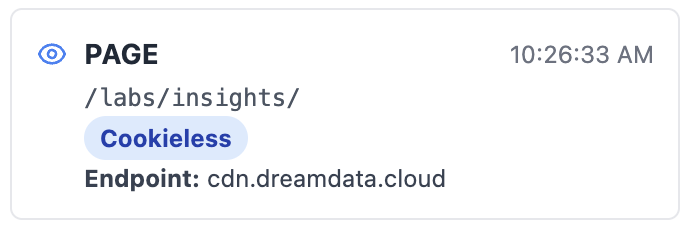
The “Cookieless” script will have a blue tag. This should fire when the page is
first opened, and for page views after cookies are rejected:
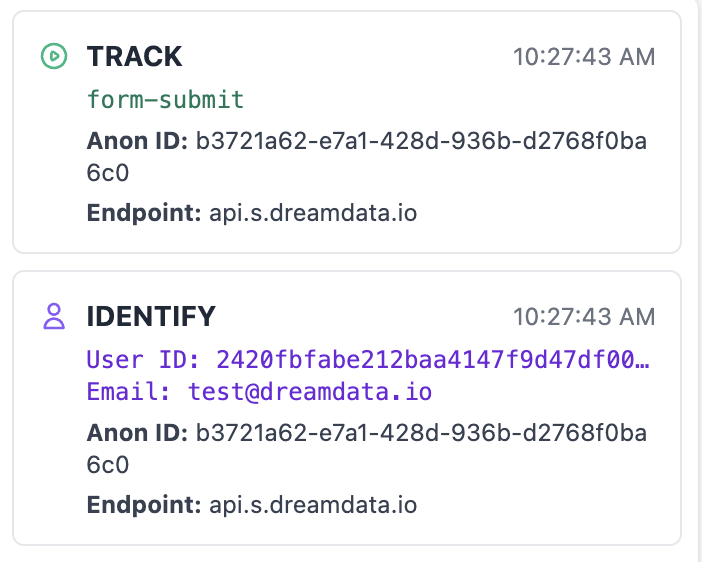
The track and Identify event should show up when a form is submitted:
Expected behavior
- Upon loading the cookieless script is fired.
- If cookes are accepted:
- The normal script is now fired.
- As the user navigates to new pages the normal script is fired.
- For form tracking, we expect to see a form event along with an identify event.
- If cookes are denied:
- As the user navigates only the cookieless script is fired.
- If they fill in a form this is not tracked. In all cases the anonymous id should match between events so that these can be linked to a single person in Dreamdata.
Common Issues
Page view does not trigger when cookies are accepted.
This is what it should look like when a user accepts cookies:
An incorrect set up is when only the cookieless event is showing after cookies have been accepted. When this happens the traffic will be counted as direct for the next page clicked. To make sure the customer journey is complete, adjust your set-up so that the normal script fires when cookies are accepted. You can do this by adding a trigger for after the user responds to the cookie banner. The specific set-ip will differ from site to site.
Method 2: Browser Debugging
Step 1: Verify Script Injection
-
Open Chrome Developer Tools: Right-click on your webpage and select
Inspect. This will open the Chrome Developer Tools. (This applies to other browsers as well.) -
Search for the Script:
- Go to the
Elementstab. - Press
Cmd + F(Mac) orCtrl + F(Windows) to open the search bar. - Search for
dreamdatato locate the Dreamdata script.
- Go to the
-
Check Script and Write Key:
- Ensure the script is correctly injected into the page.
- Verify that the
writeKeyin the script matches the one provided by Dreamdata.
Step 2: Verify Event Tracking
-
Open the Network Tab:
- Navigate to the
Networktab in Chrome Developer Tools. - Filter the requests by selecting
Fetch/XHRand typingdreamdata.
- Navigate to the
-
Check Requests:
- Refresh the page and look for requests to the Dreamdata server.
- Click on the requests to inspect the payload and ensure the correct data
(e.g.,
writeKey,userKey,anonymousId) is being sent.
Step 3: Verify Form Tracking
-
Submit a Form:
- Fill out and submit a form on your website.
- Check the
Networktab for new requests.
-
Inspect Requests:
- Look for
identifyandtrackrequests. - Verify that the form submission data (e.g., email, user ID) is correctly captured and sent to the Dreamdata server.
- Look for
Step 4: Advanced Debugging (Optional)
-
Set Breakpoints:
- Go to the
Sourcestab. - Set an XHR breakpoint by adding
dreamdata.
- Go to the
-
Pause and Inspect:
- Submit a form or refresh the page.
- When the breakpoint hits, inspect the requests step-by-step.
Method 3: Dreamdata App Debugger
-
Navigate to the Debugger:
- Log in to the Dreamdata app.
- Go to
Data Platform>Debugger.
-
Inspect Events:
- Reset any filters to view all events.
- You will see the events (e.g., page views, form submissions) that were captured.
-
Filter Events:
- Use filters to view specific types of events like
track,identify, orpageevents. - Inspect the details of each event to ensure data is correctly tracked.
- Use filters to view specific types of events like
This video guide covers Method 2 and 3.